NOTICE: Internet Explorer was retired by Microsoft on June 15th, 2022 and is no longer supported. This could change how you access Online Banking.
Economic Outlook Second Quarter 2022

Contents
- Time Will Reveal
- Federal Reserve Change in Policy
- Inverted Yield Curve Concerns
- Higher Rates and the Housing Market
- Faster Recovery, Shorter Cycle
- Outlook for Financial Markets
- Summary
Time Will Reveal

Scott Love, CAIA®, CIMA® | EVP & Chief Investment Strategist
April 19, 2022 — The first quarter of 2022 was one of the roughest on record for financial markets. There were several different reasons for this; however, the war in Ukraine has been the single most major influence. The Russian invasion is the largest incursion in Europe since World War II, and this tragic situation still has uncalculated humanitarian consequences. Domestic equity markets reflected some of this tragedy when they bottomed out on February 24th, the day of the invasion. Though, the S&P 500 Index somewhat recovered to end the quarter down 4.60%.
The war between Russia and Ukraine has been building for several quarters, and it was largely ignored by financial markets. The pivot in policy from the Federal Reserve was more sudden and caught investors off-guard. At the end of 2021, the Federal Reserve was expecting three 25-basis-point increases in Federal Funds rates during 2022. As of April 18th, futures markets are pricing in eight 25-basis-point hikes by the end of the year. The sudden change in policy drove fixed-income indexes lower. For the first quarter, the Bloomberg U.S. Aggregate Bond Index fell by 5.93%. Quarterly results in the fixed-income space were some of the worst since 1976.
Since 1976, negative quarterly returns for both equity and fixed-income markets have occurred 19 times. In addition, this marks the fifth time that returns for fixed income were more negative relative to equity market indices. Moreover, there are four periods of negative returns for equity and fixed-income benchmarks for two consecutive quarters, with three of these instances being connected with recessions.
We do not expect a recession in 2022. Equity markets may recover during the year. However, pressures facing fixed-income asset classes are not expected to abate.
Federal Reserve Change in Policy
As detailed above, futures markets are reflecting a significant change in rate hike expectations over the next couple of months. The acceleration in inflation appears to have many rethinking the speed at which the Federal Reserve needs to move to slow inflation. The war in Ukraine has compounded inflation and supply chain pressures. On a year-to-date basis, the Bloomberg Commodity Index has risen 34.4%, led by the Energy sub index (up 64.1% over the same period).
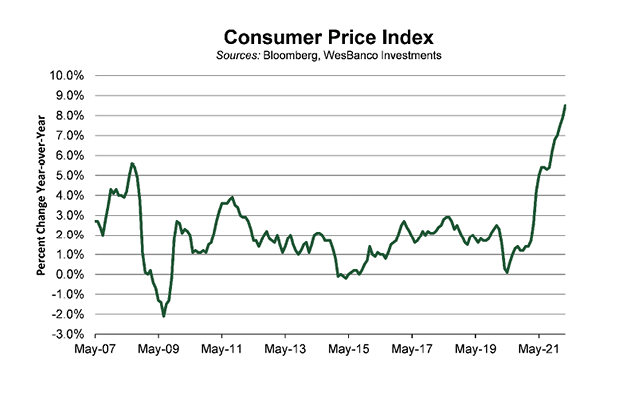
Currently, the U.S. Consumer Price Index (CPI) has increased by 8.5% year-over-year. Its highest reading since 1982. To combat the jump in inflation, the Federal Reserve increased federal funds rates by 0.25% at its March meeting. The move in short-term rates was the first increase since December 2018. During the March meeting, the Federal Reserve Open Market Committee (FOMC) penciled in seven rate increases for 2022, up from the three it originally offered in its December projections. More recently, several FOMC members have suggested that 50-basis-point hikes are appropriate given their views on inflation. As a result, fixed-income markets are pricing in Federal Funds rates that will be 2.50% by the end of the year. That would be the highest reading since 2019.
Longer-dated bond yields are also reflecting the FOMC’s projection, with the 10-year Treasury yield at 2.8%. The yield on the 10-year Treasury began the year at 1.50%. Sharp moves higher in fixed-income yields are not uncommon; however, the magnitude and speed of this change stands out. Since 1976, the Bloomberg U.S. Aggregate Bond Index has only declined by more than 5% during the quarter on three occasions. Those periods include the first quarter of 2022, the first quarter of 1980 (-8.7%), and the third quarter of 1980 (-6.6%).
The sharp increase in rates, slowdown in growth expectations, and fears that the FOMC will be too aggressive in fighting inflation have led to partial inversion of the yield curve.
Inverted Yield Curve Concerns
Since 1970, the shape of the U.S. Treasury yield curve has generally served as a good indicator of economic and financial conditions. Inverted yield curves have predicted every recession in the last 50 years. Typically, a yield curve inversion has led a recession by roughly 6 to 24 months, with a notable false alarm in 1998. The two primary segments of the U.S. Treasury curve used for recessionary signals are: the spread between 2-year and 10-year yields and the spread between 3-month and 10-year yields. These spreads highlight the relationship between Federal Reserve policy accommodation (reflected in short-term yields) and growth and inflation expectations (tied to longer-dated yields).
The 3-month/10-year curve is more reflective of this policy and economic balance in real time. Given its short investment horizon, 3-month yields tend to reflect Federal Reserve policy rates over the very near-term. This spread currently sits at 2.09%, but we expect this spread to narrow (or flatten) as the Federal Reserve continues to raise rates. However, by this measure, the Federal Reserve has ample room to tighten its policy stance without threatening a curve inversion.
The 2-year/10-year yield curve offers the Federal Reserve far less breathing room. This segment of the curve is more forward-looking by nature with 2-year yields accounting for policy rates further into the future. The 2-year/10-year spread is currently hovering near 0.30% having flattened by 125 basis points (1.25%) since last March.
The spread between 2-year and 10-year yields has recovered after briefly turning negative in early April. In our view, the 2-year/10-year yield curve inversion reflects concerns that the Federal Reserve is behind in its plan to increase interest rates. The modest bounce back in yield curve spreads followed comments made by several FOMC members about their focus on data, while being more hawkish with respect to inflation readings. Tight spreads seen across the fixed-income yield curve are promoting more caution within client portfolios.
Higher Rates and the Housing Market
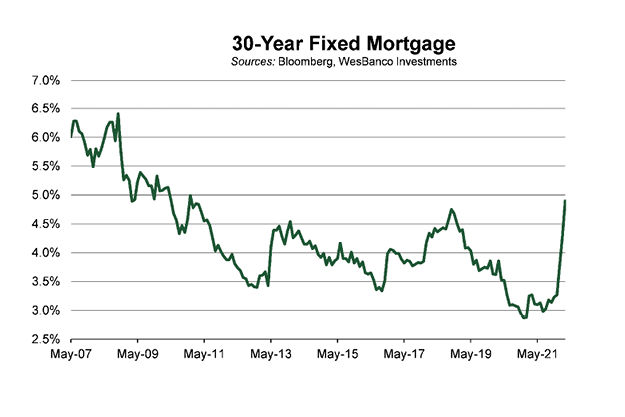
The move in Treasury markets is also impacting borrowing rates for home buyers. The average 30-year fixed mortgage rate of 5.3% is up from 3.1% at the end of 2021. The last time mortgage rates were this high was 2009. In addition, the move higher in housing prices has significantly increased monthly payments for homeowners. The median price for an existing home stood at $310,600 in February 2021, or 14.9% above pre-pandemic levels. The latest reading is up another 15.0% to $357,300. This marks 120 consecutive months of year-over-year home price increases, the longest streak on record.
Given the rise in interest rates and prices, the monthly payment for the median existing home is now $650 more per month compared to the same period a year ago. It is $720 more per month above pre-pandemic levels. Over time, this should have an impact on discretionary consumer spending, and it should be reflected in retail sales over the next several quarters.
The expected slowdown in the housing market has yet to materialize, with purchase indexes largely unchanged over the past year. Demand continues to appear strong. Homes sold on the market are listed for an average of 18 days. Eighty-four percent of homes sold in February 2022 were on the market for less than a month. Higher prices have not brought about more inventory, though. Unsold homes are sitting at a 1.7-month supply at the current sales pace.
However, refinancing indexes have dropped significantly as rates have increased. Also, home builder sentiment has weakened, dropping for four consecutive months, and it sits at its lowest reading since September. It appears that the sudden rise in interest rates, rising home prices, and escalating material costs have significantly reduced affordability in the entry-level market. Prospective buyer traffic is at its lowest reading in eight months.
Faster Recovery, Shorter Cycle
The pandemic-induced recession ended nearly two years ago, and it was the shortest on record at two months. Since the end of World War II, the average recession has lasted 10 months. Given that several economic data points have quickly recovered and are near prior peak levels, we could argue that the U.S. is further along in the economic cycle. For example, the U.S. labor market is near fully recovered with 151 million employees on nonfarm payrolls, which is 98.7% of the prior peak reading. The March unemployment rate of 3.6% is near on par with the 3.5% pre-pandemic reading. During the 2001 recession, it took the labor market nearly four years to fully recover, and it took six and a half years to bounce back following the 2008-09 recession. Other data points in the manufacturing segment and financial markets are near prior peak readings, as well.
Outlook for Financial Markets
Given the rise in Treasury yields, prices of bonds and yields on new issues are becoming more attractive. However, real yields (nominal yields minus inflation rates) remain negative. In addition, more than 30% of the S&P 500 Index has a dividend yield greater than the 10-year Treasury.
The more pressing concern for investors is the yield curve inversion and the potential for a recession. Based on the prior seven 2-year/10-year yield curve inversions, the average start to a recession is 16 months. Furthermore, over the past 12 months, the S&P 500 Index was up an average of 11%. During these seven periods (six recessions and one false signal), the range of one-year returns for the S&P 500 Index was -3% to +27%. Even over shorter periods (one month, three months, and six months), the S&P 500 Index reported positive average returns.
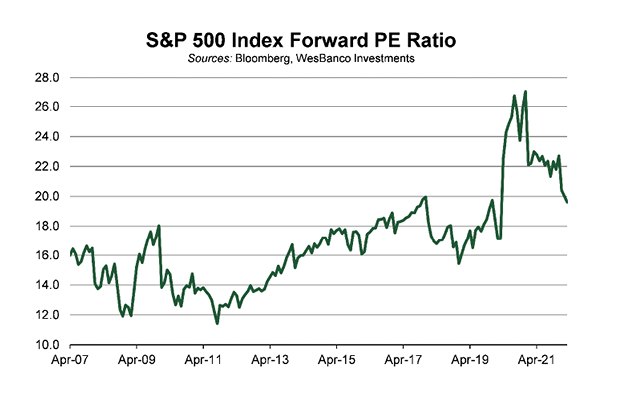
The weakness in equity indexes has resulted in valuations moving more in line with the long-term average. At the end of 2021, the S&P 500 Index was trading at a forward Price-to-Earnings (P/E) ratio of 22.7x, versus the 20-year average of 16.5x. Earnings for the S&P 500 Index companies are expected to increase by 15% for 2022, providing some support to prices as the P/E ratio moves closer to the long-term average.
In addition to looking at equity valuations compared to long-term averages, we consider them relative to fixed-income yields. Earnings yields (or inverse P/E multiple) minus current Treasury yields give investors the equity risk premium. Currently, that figure stands at 222 basis points, well above the long-term average of 67 basis points. Since 1960, readings in this range typically produce equity returns that are slightly above the long-term average. However, if P/Es moderate and fixed-income yields move higher, the equity risk premium would fall to levels that would make bonds slightly more attractive relative to equities.
Summary
The events unfolding in Europe have increased risks over the past several months. However, we do not believe the war in Ukraine will lead to a recession in the U.S. According to the most recent data, Russia has a GDP of $1.6 trillion while Ukraine’s GDP is closer to $181 billion. Combined, they have a GDP that is like New York, or good enough for the third largest state in the U.S. However, the war is affecting already stressed supply chains and inflation readings.
The FOMC will be aggressive in hiking rates for the remainder of 2022 to slow inflation. This forceful move increases the odds that they overshoot and tighten too far. However, those probabilities are reflected in the yield curve. We continue to expect that the U.S. will not enter a recession in 2022, but the economic readings suggest that we may be further along in this cycle than many would have anticipated.
Recent Insights
-

The First 5 Years: Financial Moves Every Physician Should Make to Build Long-Term Wealth
After years of medical school, residency, and fellowship, you've finally reached a major milestone: your career as a practicing physician is underway.
-

Mitigating Risk: Tips to Protect Your Business from Fraud
Fraud is no longer just a concern for large corporations. Today, growing businesses of all sizes are increasingly being targeted by scams designed to disrupt operations, compromise sensitive information, and impact cash flow.
-

Understanding Your Mortgage Options: Finding the Right Home Loan for Your Next Move
Today’s home buyers are entering the market with very different goals, timelines, and financial realities than generations before. Some are purchasing their first home, while others may be refinancing, building, renovating, or planning for a growing family.