NOTICE: Internet Explorer was retired by Microsoft on June 15th, 2022 and is no longer supported. This could change how you access Online Banking.
Economic Outlook Third Quarter 2022

Content
- Increasing Concerns Weigh on Markets
- Increasing Concerns of Recession
- Nonfarm Payrolls Remain Strong
- Income Levels Showing Signs of Weakness
- Consumer Spending Levels Are Mixed
- Industrial Production Remains Near Highs
- Equity Market Earnings Moderating
- Our Thoughts
Increasing Concerns Weigh on Markets

Scott Love, CAIA®, CIMA® | EVP & Chief Investment Strategist
On July 27th, the Federal Reserve increased the Federal Funds Rate by 0.75%, moving its upper bound to 2.50%, its highest reading since 2019. During a subsequent press conference, Federal Reserve Chairman Jerome Powell reinforced his view that the U.S. economy was not in a recession. However, the possibility of a recession would not deter Fed officials from increasing rates to fight inflation. By guiding the year-end Federal Funds Rate to a potential 3.25% to 3.50% range, Powell has reinforced the view maintained by the market. Additional guidance from the futures market would imply a 0.50% hike at the September meeting and 0.25% hikes at the November and December meetings.
However, Powell warned that forward guidance could become less clear, likely to maintain policy flexibility. Given the evolving economic conditions, maintaining its focus on being data-dependent will help restore the Federal Reserve’s creditability.
The reaction within fixed income markets was swift during the press conference. The policy-sensitive (1- to 5-year) portion of the U.S. Treasury yield curve declined by 0.07% – 0.09%, reacting to Powell’s suggestion that rate hikes were not on autopilot. The longer end of the curve rose on the day, slightly steepening this overall measure.
The 2/10-year U.S. Treasury curve remains inverted (or the 10-year yield is lower than the 2-year yield) by roughly 0.20%. This part of the curve remains near its deepest inversion in more than 20 years. Our preferred yield curve indicator, the 3-month/10-year Treasury curve, remains positively sloped, but it has narrowed dramatically in recent weeks. Currently, 0.40% separates the yields at these two points, compared to 1.80% less than three months ago.
The U.S. yield curve is not a perfect predictor of future recessions; however, it has amassed a strong record of accomplishment for signaling future economic weakness. A 2/10-year yield curve inversion has led the last six U.S. recessions by an average of 16 months, while signaling a notable false positive in 1998.
Increasing Concerns of Recession
Over the past several months, clients have often asked whether the U.S. is already in a recession. Questions of this nature are natural when investors look at quarterly Gross Domestic Product (GDP) readings, the Treasury yield curve, and the actions of the Federal Reserve.
First quarter GDP was reported at -1.6%, led by an inventory build and weak net exports. Following the first quarter, the U.S. dipped by 0.9% for the second quarter. That marked two consecutive quarters of declining economic activity, a traditional hallmark of a recession. However, the National Bureau of Economic Research (NBER) weights several different economic readings to determine the beginning and end of recessions. While notoriously vague, the four areas of focus include employment, incomes, consumer spending, and industrial production. Even with these readings, the NBER tends to report turning points in the U.S. with a significant delay. For instance, on July 19, 2021, the NBER finally declared that the 2020 recession had ended in April 2020.
Nonfarm Payrolls Remain Strong
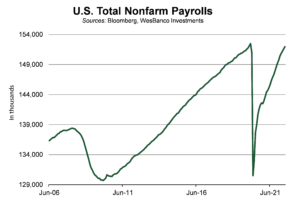
Over the past six months, U.S. hiring trends have slowed from their breakneck speeds of 2021, but they remain well above the long-term average. In June, U.S. nonfarm payrolls increased by 372,000 while the unemployment rate held steady at 3.6%. There have been 2.74 million
jobs created in 2022 alone, or an average of 457,000 per month. This is compared to 6.74 million jobs created, or a monthly average of 562,000, in 2021. While the pace of hiring has slowed, it remains well above the long-term average of 125,000.
Despite these compelling monthly figures, weekly initial jobless claims are starting to move higher. Over the past several months, the four-week moving average of initial jobless claims has risen from 199,000 to 256,000. While in line with the long-term average, this move higher suggests some concern within labor markets. Current readings may reflect slowing economic activity, or an act of over hiring coming out of the pandemic. Regardless of the reason, jobless claims support the Federal Reserve’s desire to increase the unemployment rate over the next several years.
The Federal Reserve holds a long-term target of 4.0% for the U.S. unemployment rate. At this level, inflation will likely moderate and move closer to its long-term forecast.
Overall, current employment readings are strong and do not signal a weak economy. In addition, the U.S. has never had a recession while maintaining such strong job growth.
Income Levels Showing Signs of Weakness
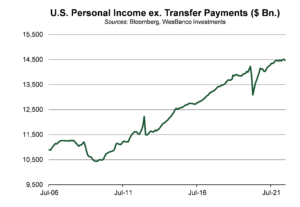
COVID-19 stimulus programs skewed personal income readings over the past several years, making comparisons difficult. In the decade prior to the start of the global pandemic, U.S. personal incomes rose by an average annualized rate of 4.3%. Over the same period, personal income excluding transfer payments (government social payments) posted slower growth at an average of 2.85%. While the pandemic enhanced unemployment benefits, and stimulus programs pushed personal incomes to record highs, incomes excluding transfer payments modestly improved over the past two and half years. More recently, the effects of inflation have further diluted income gains for consumers. In May, real disposable incomes excluding transfer payments dropped 0.8% from a year ago, its third consecutive year-over-year decline.
Should wages continue to lag inflation, U.S. consumers will have to dip into savings to maintain spending levels or cut back on expenses. Over the next several months, though, we would anticipate that wages will endure, and inflation will moderate. The result will be positive gains in real disposable income for U.S. workers.
Consumer Spending Levels Are Mixed
 The U.S. consumer accounts for nearly two-thirds of U.S. GDP. Therefore, spending levels are followed with great interest. During the pandemic, U.S. consumers were flush with stimulus checks and “free” time due to lockdowns, so they binged by spending on goods. Currently, U.S. retail sales of $680.6 billion are 29.9% above their pre-pandemic high. This represents an average year-over-year increase of 10.7%. In the decade prior to the pandemic, U.S. retail sales rose at an average annual rate of 4.3%. The June retail sales report highlighted that the total amount spent increased by 1.0% for the month, led by higher gasoline prices. Gasoline prices during June were well above $5 per gallon in most of the U.S., and in some places, they were closer to $6 per gallon. The result was a 3.6% increase in gasoline sales. However, adjusting for prices, the volume of gas purchased fell by nearly 7%. Traditionally, demand for fuel is inelastic, meaning price changes do not have a substantial impact on demand. As a result, the drop in demand, coupled with rising gasoline inventories, has many worried that consumers are beginning to pull back on spending.
Personal consumption levels have slowed, too. But they are still growing on a year-over-year basis. Services spending continues to accelerate, suggesting that consumers are switching from goods to activities.
Industrial Production Remains Near Highs
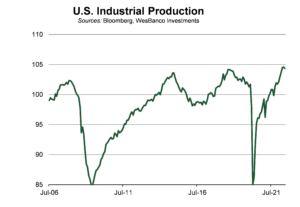
Total industrial production declined by 0.2% in June, but it was up 4.2% on a year-over-year basis. This slight decline from May was led by weakness in manufacturing and utilities. Using the June ISM Manufacturing Index as a guide, demand is slowing. The new orders component of the index slipped into contraction territory for the first time since reopening in 2020.
The weakness in production was reinforced by the most recent durable goods data. While the initial figures were better than expected, representing the fastest monthly change in six months, the data highlighted slowing demand. Looking at private-sector activity, after inflation related adjustments, core capital goods orders were modestly negative. Despite recent weakness, we believe that demand is slowing, but it is not collapsing.
Equity Market Earnings Moderating
S&P 500 Index companies are beginning to report second quarter earnings, and the results have highlighted several headwinds. Thus far, 48% of S&P 500 Index companies have reported second quarter earnings. Approximately 73% of these companies have reported earnings above consensus estimates. However, in the past four years, nearly 80% of S&P 500 companies have posted earnings above consensus estimates, suggesting possible weakness. There are three general reasons for this: supply chains, tight labor markets, and a stronger U.S. dollar.
For S&P 500 Index companies, it is estimated that nearly 40% of revenues are generated from international markets. Relative to a basket of global currencies, the U.S. dollar is at a 20-year high. The stronger U.S. dollar will negatively influence earnings if current levels persist. The current earnings per share for the S&P 500 Index is forecast to be 13.5% to 15.5% above 2021 figures. The recent weakness in equity indexes has been driven by valuations and not earnings growth. At the end of 2021, the S&P 500 Index was trading at a forward Price-to-Earnings (P/E) ratio of 22.7x versus the 20-year average of 16.5x. Given recent weakness in earnings, many investors are worried that this is the next market headwind. However, if the Federal Reserve can achieve its narrow path to a soft-ish economic landing, earnings for the S&P 500 Index will likely avoid a recession-led decline.
Our Thoughts
The economic data continues to suggest that growth is slowing within the U.S.; however, we’re likely not in a recession. Despite posting two quarters of declining GDP, the factors that have caused the negative readings have been related to the pandemic. Over the past two quarters, personal consumption has added to economic growth, while supply chain and government spending has inhibited GDP. The U.S. labor market and industrial production readings support a growing economy, not one that is collapsing. Moreover, while spending and income levels appear to be weakening, it’s more likely the case that they are moderating following stimulus spending.
We are not Pollyannas, though. There are several indicators that are flashing caution. As a result, we continue to monitor our more critical economic indicators for signs of recession. We continue to see markets remaining volatile over the next several months. The enormous amount of global tightening that is underway works with a lag. We anticipate that this tightening will continue to slow the global economy. The odds of recession in Europe are high, and the probabilities of a U.S. drawdown have risen sharply given the Federal Reserve’s aggressive tightening actions. Many of these challenges are reflected in equity market prices.
Historically, adding to equities after they have been down 20% from record highs have been a good proposition for long-term investors. Looking at past examples, the S&P 500 Index has risen higher three years later in eight out of nine cases with an average return of 29%. Shorter-term returns are more mixed and are influenced by whether the economy went into recession.
Given the wide range of outcomes, we do not view this as a time for investors to be aggressive. Rather, we suggest they maintain their fixed income and equity allocations. However, as economic and market conditions change, the WesBanco team stands ready to take advantage of opportunities as they present themselves.
Recent Insights
-

The First 5 Years: Financial Moves Every Physician Should Make to Build Long-Term Wealth
After years of medical school, residency, and fellowship, you've finally reached a major milestone: your career as a practicing physician is underway.
-

Mitigating Risk: Tips to Protect Your Business from Fraud
Fraud is no longer just a concern for large corporations. Today, growing businesses of all sizes are increasingly being targeted by scams designed to disrupt operations, compromise sensitive information, and impact cash flow.
-

Understanding Your Mortgage Options: Finding the Right Home Loan for Your Next Move
Today’s home buyers are entering the market with very different goals, timelines, and financial realities than generations before. Some are purchasing their first home, while others may be refinancing, building, renovating, or planning for a growing family.